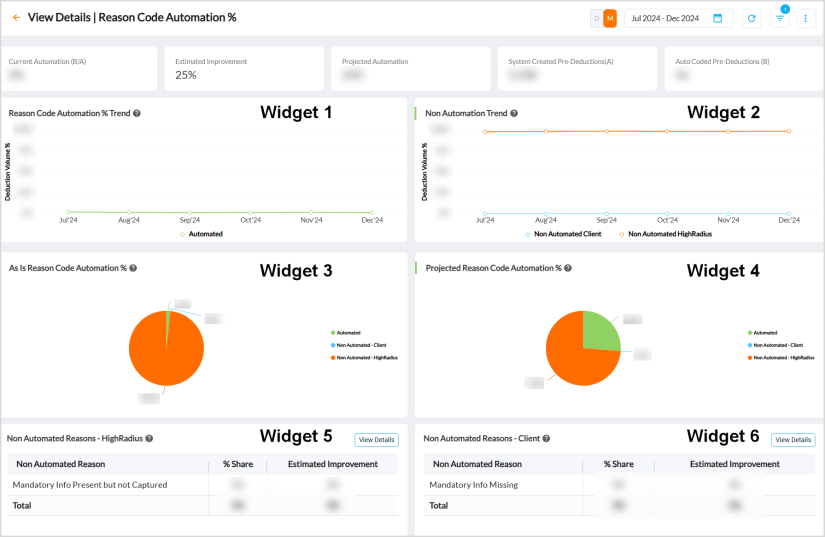
Reason Code Automation %
The Reason Code Automation % dashboard provides insights on the percentage of claims automatically coded into reasons from the entire raised claims for the selected time period, calculated using the following formula:
Reason Code Automation % = (Total number of claims auto-coded / Total number of claims raised) * 100
The tiles in the dashboard display the following average metrics for the selected time period.
-
Current Automation
-
Estimated Improvement
-
Projected Automation
-
System Created Pre-Deductions
-
Auto Coded Pre-Deductions
For more details, refer to Viewing Dashboards.
Widget 1 - Reason Code Automation % Trend
The Reason Code Automation % Trend widget displays a spline chart of the monthly percentage trend of the claims auto-coded into reasons.
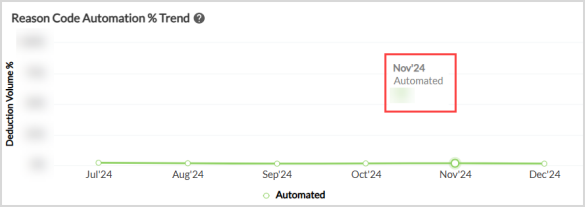
Hovering over the series displays a tooltip![]() A tooltip is used to specify extra information about something when the user moves the mouse pointer over an element. of the month and the respective percentage of Automated value.
A tooltip is used to specify extra information about something when the user moves the mouse pointer over an element. of the month and the respective percentage of Automated value.
Widget 2 - Non Automation Trend
The Non Automation Trend widget displays a spline chart of the monthly percentage trend of claims that could not be auto-coded into reasons from client and HighRadius.
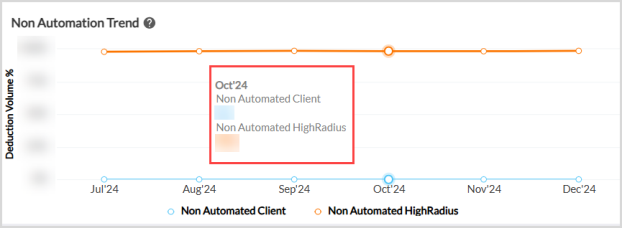
Hovering over the series displays a tooltip of the month and the respective percentage values of non-automated claims from client and HighRadius.
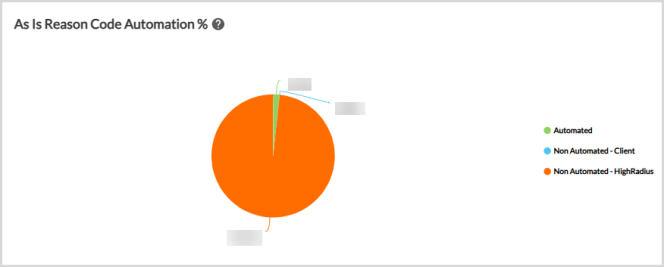
Widget 3 - As Is Reason Code Automation %
The As-Is Claim to Deduction Linking % widget displays a percentage pie chart of the average distribution of the following claim categories.
-
Automated
-
Non Automated - Client
-
Non Automated - HighRadius
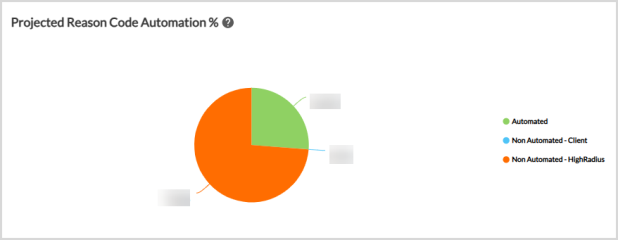
Widget 4 - Projected Reason Code Automation %
The Projected Claim to Deduction Linking % widget displays a percentage pie chart of the projected distribution of the following claim categories.
-
Automated
-
Non Automated - Client
-
Non Automated - HighRadius
Widget 5 - Non Automated Reasons - HighRadius
The Non Automated Reasons - HighRadius widget provides a distributed percentage view of the non-automated shares, segregated into reasons accounted for HighRadius. The widget also displays the estimated improvement percentage that can be achieved for a specific reason.
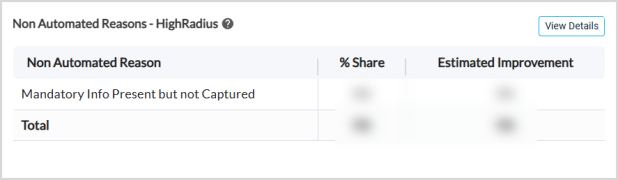
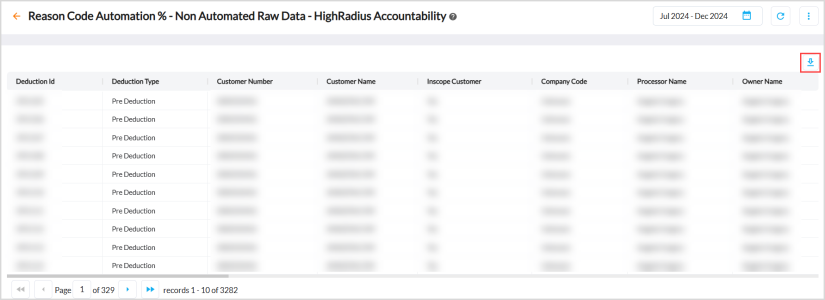
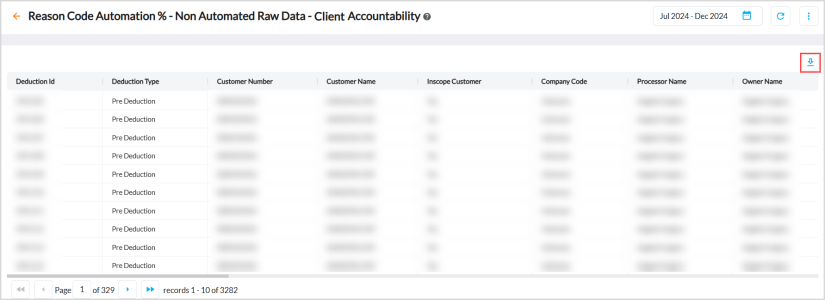
Clicking View Details further displays data of the deductions that could not be automated. Click the download icon to export the entire data as a CSV file.
Widget 6 - Non Automated Reasons - Client
The Non Automated Reasons - Client widget provides a distributed percentage view of the non-automated shares, segregated into reasons accounted for client. The widget also displays the estimated improvement percentage that can be achieved for a specific reason.
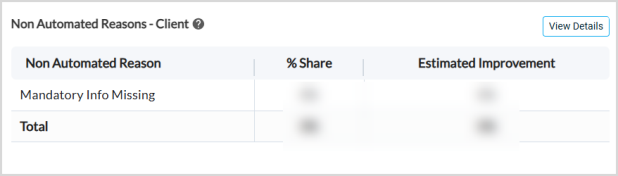
Clicking View Details further displays data of the deductions that could not be automated. Click the download icon to export the entire data as a CSV file.
Out-of-the-Box Features
The Out-of-the-Box features and functionalities of the dashboard are as follows:
-
Date Range - Filters data displayed in the dashboard as per the required date range.
-
Daily or Monthly Toggle - Switches the entire dashboard metrics and trends to daily (D) or monthly (M) view.
-
Standard Out of the Box Filters - Filters the entire dashboard on the basis of Company Code and Company Code.
-
Kebab Menu - Click this icon to access options such as download, schedule, and mark the dashboard as favorite. For more details, refer to Using Kebab Menu Options.