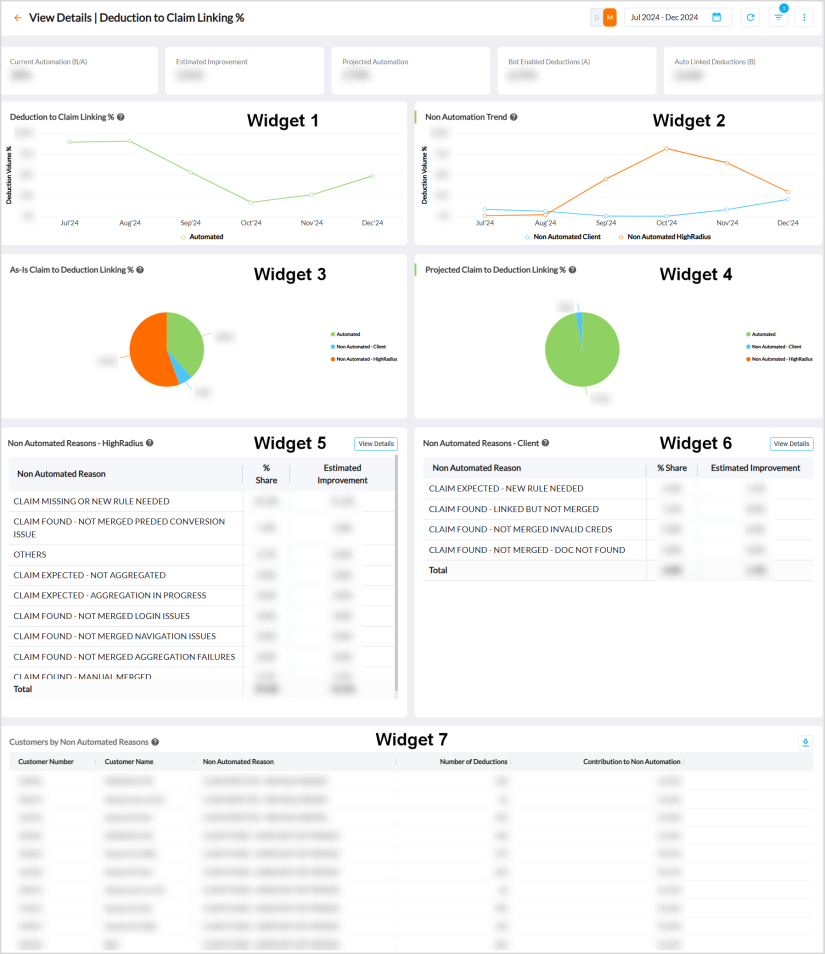
Deduction to Claim Linking %
The Deduction to Claim Linking % dashboard provides insights on the percentage of deductions automatically linked to the downloaded claims (for bot-enabled customers) for the selected time period, calculated using the following formula:
Deduction to Claim Linking % = (Total bot enabled deductions with auto-linked claims / Total bot-enabled deductions created) * 100
The tiles in the dashboard display the following average metrics for the selected time period.
-
Current Automation
-
Estimated Improvement
-
Projected Automation
-
Bot Enabled Deductions
-
Auto Linked Deductions
For more details, refer to Viewing Dashboards.
Widget 1 - Deduction to Claim Linking %
The Deduction to Claim Linking % widget displays a time-series chart of the monthly percentage trend of deduction to claim linking.
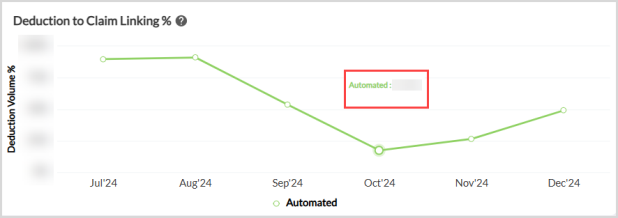
Hovering over the series displays a tooltip![]() A tooltip is used to specify extra information about something when the user moves the mouse pointer over an element. of the Automated value of the deduction to claim linking percentage, for the respective month on X-axis.
A tooltip is used to specify extra information about something when the user moves the mouse pointer over an element. of the Automated value of the deduction to claim linking percentage, for the respective month on X-axis.
Widget 2 - Non Automation Trend
The Non Automation Trend widget displays a time-series chart of the monthly trend of non-automated claim linking deductions percentage from client and HighRadius.
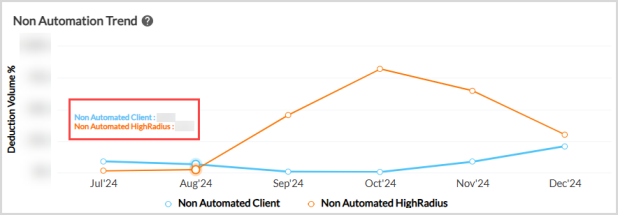
Hovering over the series displays a tooltip of the non-automated claim linking deductions percentage values from client and HighRadius, for the respective month on X-axis.
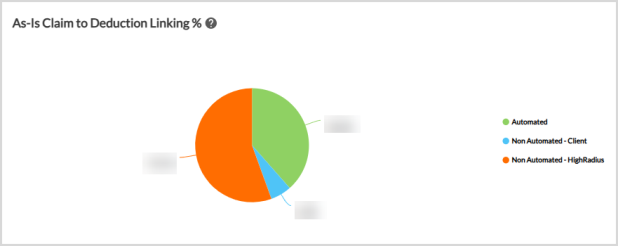
Widget 3 - As-Is Claim to Deduction Linking %
The As-Is Claim to Deduction Linking % widget displays a percentage pie chart of the average distribution of the following claim to deduction linking categories.
-
Automated
-
Non Automated - Client
-
Non Automated - HighRadius
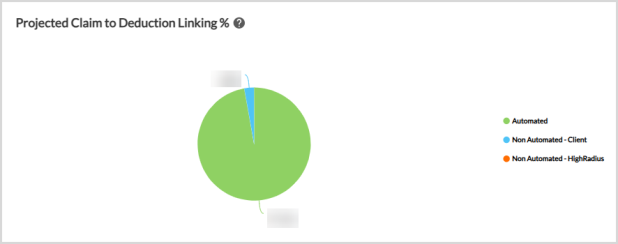
Widget 4 - Projected Claim to Deduction Linking %
The Projected Claim to Deduction Linking % widget displays a percentage pie chart of the projected distribution of the following claim to deduction linking categories.
-
Automated
-
Non Automated - Client
-
Non Automated - HighRadius
Widget 5 - Non Automated Reasons - HighRadius
The Non Automated Reasons - HighRadius widget provides a distributed percentage view of the non-automated shares, segregated into reasons accounted for HighRadius. The widget also displays the estimated improvement percentage that can be achieved for a specific reason.
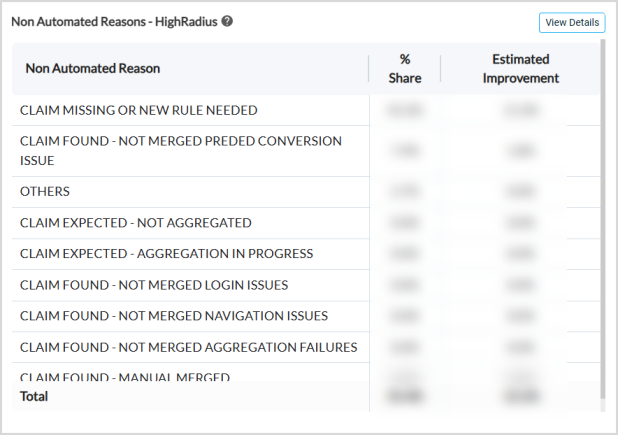
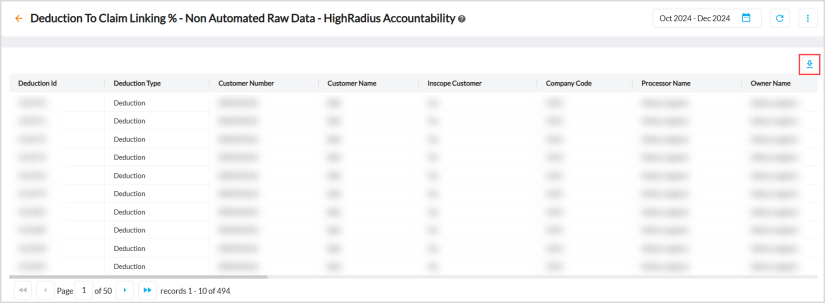
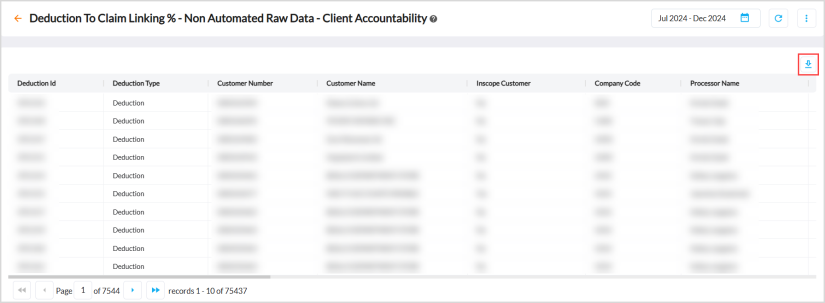
Clicking View Details further displays data of the deductions that could not be automated. Click the download icon to export the entire data as a CSV file.
Widget 6 - Non Automated Reasons - Client
The Non Automated Reasons - Client widget provides a distributed percentage view of the non-automated shares, segregated into reasons accounted for client. The widget also displays the estimated improvement percentage that can be achieved for a specific reason.
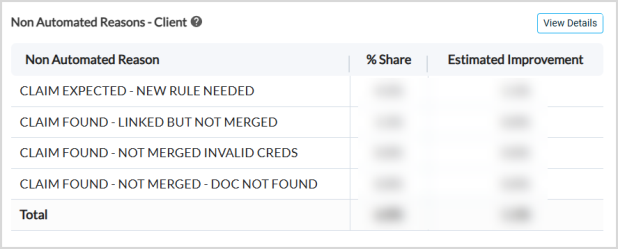
Clicking View Details further displays data of the deductions that could not be automated. Click the download icon to export the entire data as a CSV file.
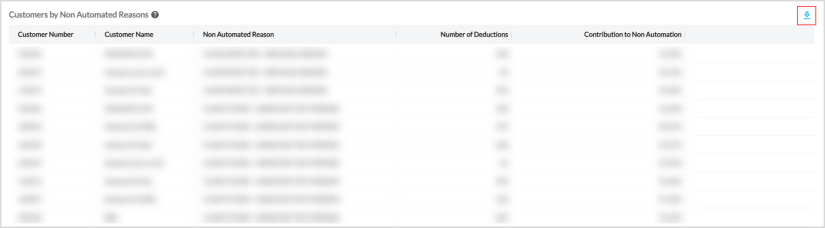
Widget 7 - Customers by Non Automated Reasons
The Customers by Non Automated Reasons widget displays data of the customers that contributed in the non automation percentage bucket. Click the download icon to export the entire data as a CSV file.
Out-of-the-Box Features
The Out-of-the-Box features and functionalities of the dashboard are as follows:
-
Date Range - Filters data displayed in the dashboard as per the required date range.
-
Daily or Monthly Toggle - Switches the entire dashboard metrics and trends to daily (D) or monthly (M) view.
-
Standard Out of the Box Filters - Filters the entire dashboard on the basis of Reason Code and Company Code.
-
Kebab Menu - Click this icon to access options such as download, schedule, and mark the dashboard as favorite. For more details, refer to Using Kebab Menu Options.