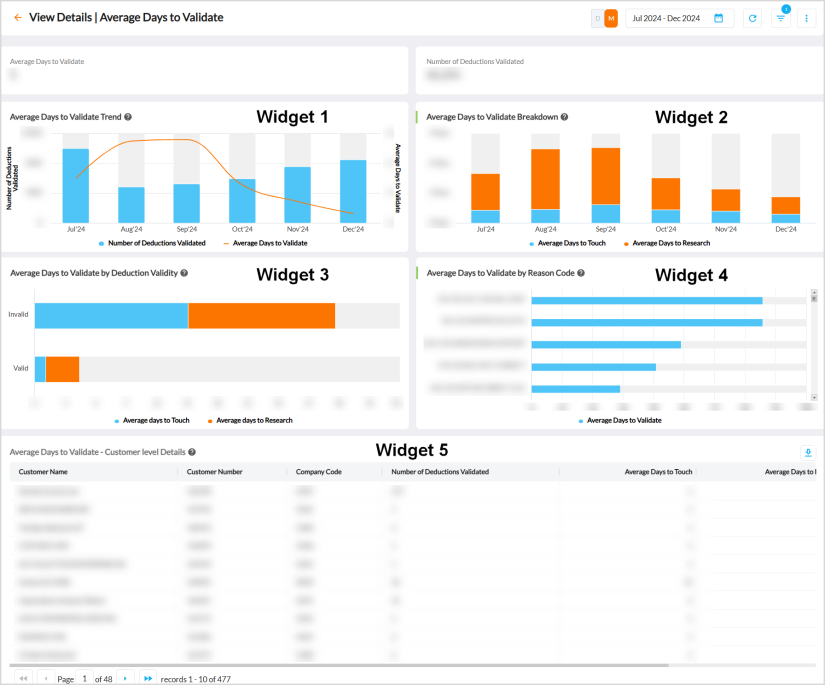
Average Days to Validate
The Average Days to Validate dashboard provides insights on the average days taken to validate deductions (valid or invalid) from their creation time, calculated using the following formula:
Average Days to Validate = Average days to touch + Average days to research
The tiles in the dashboard display the following average metrics for the selected time period.
-
Average Days to Validate
-
Number of Deductions Validated
|
|
Note The computational constraints for calculating the metrics are as follows:
|

For more details, refer to Viewing Dashboards.
Widget 1 - Average Days to Validate Trend
The Average Days to Validate Trend widget displays a spline and column chart of the monthly trend of Number of Deductions Validated and Average Days to Validate.
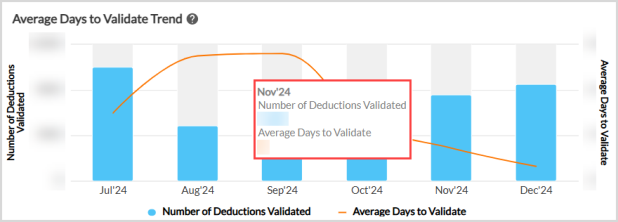
Hovering over the series displays a tooltip![]() A tooltip is used to specify extra information about something when the user moves the mouse pointer over an element. of the month and the respective Number of Deductions Validated and Average Days to Validate values.
A tooltip is used to specify extra information about something when the user moves the mouse pointer over an element. of the month and the respective Number of Deductions Validated and Average Days to Validate values.
Widget 2 - Average Days to Validate Breakdown
The Average Days to Validate Breakdown widget displays a column chart of the monthly trend of Average Days to Touch and Average Days to Research.
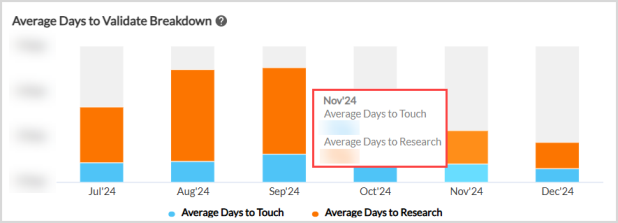
Hovering over the series displays a tooltip of the month and the respective Average Days to Touch and Average Days to Research values.
Widget 3 - Average Days to Validate by Deduction Validity
The Average Days to Validate by Deduction Validity widget is similar to Average Days to Validate Breakdown widget, which displays the average values of Average Days to Touch and Average Days to Research for valid and invalid deductions.
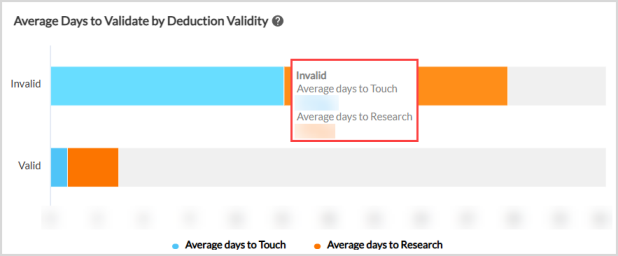
Hovering over the series displays a tooltip of the deduction type (valid or invalid) and the respective Average Days to Touch and Average Days to Research values.
Widget 4 - Average Days to Validate by Reason Code
The Average Days to Validate by Reason Code widget displays a bar chart of Average Days to Validate for reason codes.
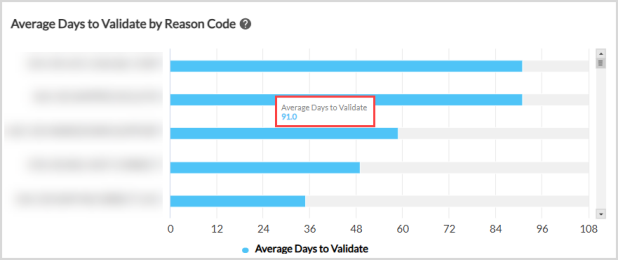
Hovering over the series displays a tooltip of Average Days to Validate value for the respective reason code on Y-axis.
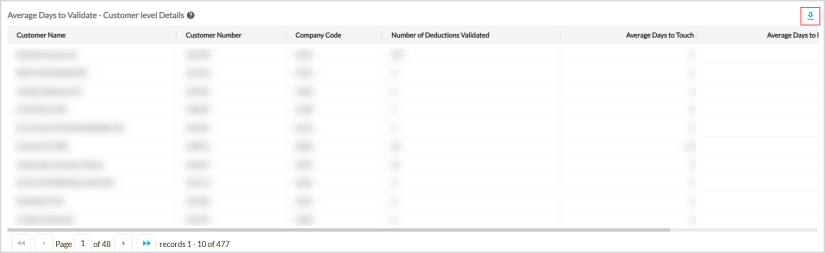
Widget 5 - Average Days to Validate - Customer level Details
The customer details widget displays the entire customer data considered for the computation of metrics in the dashboard for the selected time period. Click the download icon to export the data as a CSV file in your local system.
Out-of-the-Box Features
The Out-of-the-Box features and functionalities of the dashboard are as follows:
-
Date Range - Filters data displayed in the dashboard as per the required date range.
-
Daily or Monthly Toggle - Switches the entire dashboard metrics and trends to daily (D) or monthly (M) view.
-
Standard Out of the Box Filters - Filters the entire dashboard on the basis of Reason Code and Company Code.
-
Kebab Menu - Click this icon to access options such as download, schedule, and mark the dashboard as favorite. For more details, refer to Using Kebab Menu Options.