Deductions Resolution Time Analysis
The Deductions Resolution Time Analysis dashboard provides insights on the average days utilized for resolving deductions in the last 12 months.
|
|
Information Average days to resolve = Sum of days to resolve deductions in the selected period / Count of deductions resolved |

For more details, refer to Viewing Dashboards.
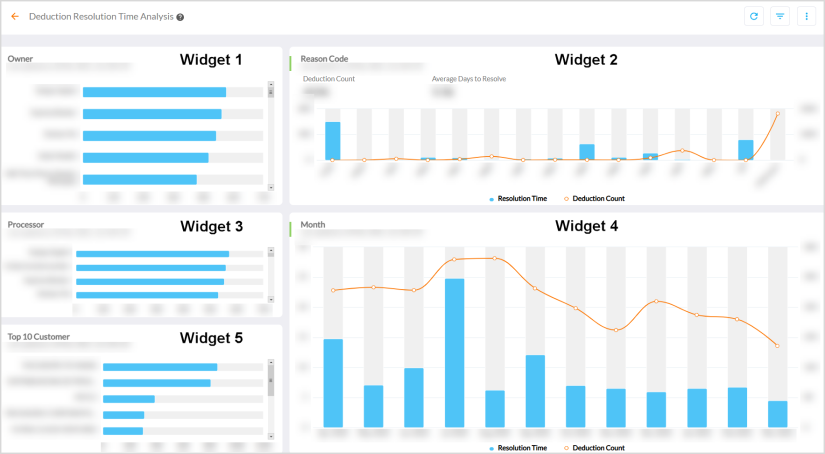
Widget 1 - Owner
The Owner widget displays a bar chart of owners and the time spent on resolving the deductions.
Hovering over the series displays a tooltip![]() A tooltip is used to specify extra information about something when the user moves the mouse pointer over an element. of owner name and the respective Resolution Time.
A tooltip is used to specify extra information about something when the user moves the mouse pointer over an element. of owner name and the respective Resolution Time.
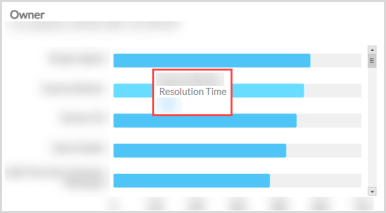
Widget 2 - Reason Code
The Reason Code widget displays a column and spline chart of volume and time spent in resolving the deductions as per the reason codes. The tiles on the widget display the overall Deduction Count and Average Days to Resolve of resolved deductions.
Hovering over the series displays a tooltip of reason code and the respective Resolution Time in days and Deduction Count of resolved deductions.
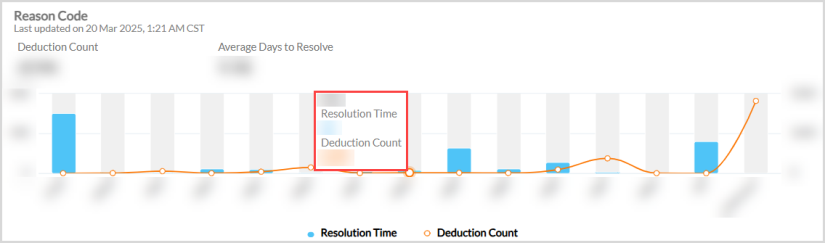
Widget 3 - Processor
The Processor widget displays a bar chart of processors and the time spent on resolving the deductions.
Hovering over the series displays a tooltip of processor name and the respective Resolution Time.
Widget 4 - Month
The Month widget displays a column and spline chart of the monthly resolved deductions and the average time utilized in resolving deductions.
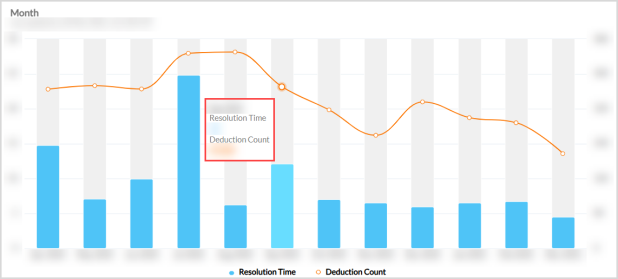
Hovering over the series displays a tooltip of month and the respective Resolution Time and Deduction Count in that month.
Widget 4 - Top 10 Customer
The Top 10 Customer widget displays a bar chart of Customers and the time spent on resolving their deductions.
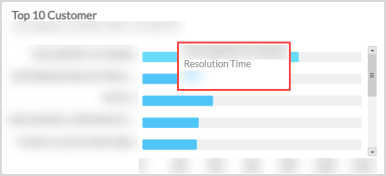
Hovering over the series displays a tooltip of Customer name and the respective Resolution Time spent.
Out-of-the-Box Features
The Out-of-the-Box features and functionalities of the dashboard are as follows:
-
Cross Filtering - Slices and dices between multiple dimensions. For example, clicking a processor in the Processor widget, filters the entire data of dashboard for that processor.
-
Standard Out-of-the-Box Filters - Filters the entire dashboard based on Deduction Type and Company Code.
-
Kebab Menu - Click this icon to access options such as download, schedule, and mark the report as favorite. For more details, refer to Using Kebab Menu Options.